

|
|
|
* This web page documents a computational tool which has been developed within the project "Indicators and Quantitative Tools for Improving the Impact Assessment Process for Sustainability" (I.Q. Tools), 6th Framework Programme of the European Commission, Contract SSP1-CT-2003-502078, Thematic Priority 8: Policy Oriented Research. See this site for a Ukrainian translation.
The motivation for this program is that computational work in economics often involves calculations followed by formatted presentation of results. Excel is a convenient but time-intensive framework of producing formatted tables and charts. The present tool is designed to reduce time cost and increase the reliability of tabular output formatted in Excel.
Microsoft offers the Windows Script Host as a tool for automation of Office Programs. When I first looked into these tools over two years ago I was put-off by the lack of thorough documentation for the Excel object model. A great number of books professing to document this interface contain the same three code fragments, and there is apparently no comprehensive documentation of all the properties and methods. There are some subtle differences between VBA and VBScript, and it is annoying that number of crucial statements needed to be figured out on a trial and error basis.
The xltable utility is a WSF file which can substantially reduce the programming work involved in moving data from text files into formatted Excel worksheets. Indeed, the native CSV format is perfectly acceptable for simply moving data files into Excel, but this approach does not reduce the work involved in formatting the data once it is in Excel.
Windows scripting tools can automate these formatting tasks, thereby improving both efficiency and reliability. The idea behind xltable is that all the subtle bits in the Windows script are are handled in the WSF file, and the user need only provide the table data and a few statements describing backgrounds, colors, lines and font styles.
The command file syntax used for formatting range objects in xltable follows the built-in Visual Basic for Applications syntax. Excel itself provides the best "documentation" for the use of VBScript to format Excel range objects. If you want to automate some aspect of a table such as row label formats etc, you can first load an unformatted version of your table in Excel, then select Tools Macro Record. This will record your subsequent actions as a VBA macro. After you have completed the changes you want to make to the table, then hit the button on the floating "macro recording box" to complete the macro.
After having recorded the macro, then enter Tools Macro Macros Edit. The Visual Basic editor then opens a file containing the VBA script you just recorded. You can use this script to discover the commands which perform a particular task on a range object, and you can copy those statements into your xltable command file. (See Jon Peltier's page which discusses limitations of the MacroRecord approach to VB programming. Bear in mind that his cautions relate to VBA while VBScript adds a range of additional subtleties.)
The program is relatively new, so I would be very pleased to receive a bug report or two. Of course, there are no warranties.
xlchart.wsf is a Windows Script Host file which contains routines which may be called by a compact user-supplied script. The user script is written in VBScript, but it does not require programming of a stand-alone program. The program operates from the command line as follows:
xltable [XLS file] VBS_command_file [-b]
When an XLS file is specified the file name indicates the name of an
Excel workbook where tables are to be written. The XLS file may
be referenced using a default path and reside in the currently
connected directory, or it may include an explicit path to the file.
If no XLS file is specified, output is written to a new workbook which
is opened under user control.The VBS_command_file is user-supplied and based on a limited number of VBScript commands. The file name specified in the invocation may provide only the file name prefix and omit a trailing .vbs, so long as the file name is unique. The file name may be specified without an explicit path provided that the file is in the working directory.
The -b is a "batch mode" switch which causes xltable to operate silently. When operating interactively xltable provides a sequence of message boxes which updates the user on which files are being updated and so forth. When operating in batch mode, no messages are generated and the updated XLS file is saved at the end of the job. The -b switch may only be applied with an explicit XLS file. It must be the last command argument.
| call LoadTable(ident,title,v,ncol,r) | Writes a table to the workbook with range label ident, title title, values v which are provided as a set of rows with ncol elements per row. The final argument to this call, r, returns the range object in the Excel file where the table has been written. |
| call DefaultFormat(ident) | Applies the default formatting to the table in range ident. This default formatting applies separate formatting to the title, column labels, row labels and data range. The user provides global variables to control the assumed table dimensions (row and column label counts), the font, the background pattern, the column width and the color index. (See ex1.gms for an illustration of the use of these options.) |
| call SetRange(ident,RangeSpec,r) | This call retries a range object for a specified portion of the table. The second argument is one of the following: "range", "title", "rowlabel", "columnlabel" or "data". ex2.vbs illustrates how this can be used. |
| Call RangeSelect(ident,nw_row,nw_col,se_row,se_col,r) |
This routine retrieves a rectangular range object for an specific set of cells from
the table. nw_row,nw_col are integer values corresonding to
the "northwest" in the target range while se_row,se_col are
the "southeast" corner in the target range. There are ncol columns
in the table which are counted from left to right. The title row
is row 1, the first row of data is row 2, etc. Specification of
se_row=0 or se_col=0 indicates that the range
extends to the bottom or final column of the table. ex3.vbs
illustrates the use of this routine. As an alternative to RangeSelect the knowledgable VB/XL programmer can "roll their own" formatting instructions using explicit references to table subranges using the Excel object model r.offset. See ex8.vbs for an illustration of how this works. |
| Call LineChart(ident) | This routine generates a simple line chart using the data provided in an existing table. See ex6.vbs for an illustration of this routine. |
| Call Histogram(ident) | This routine generates a simple clustered column chart using the data provided in an existing table. See ex7.vbs for an illustration of this routine. |
| ident | is the VBScript identifier which may be used as the range name for the table in the Excel file. (This is the first argument in the call to LoadTable. The ident symbol need not be used -- an explicit string argument may be passed to LoadTable.) |
| title | is the VBScript text string used as the range name for the table in the Excel file. (This is the second argument in the call to LoadTable. The title symbol need not be used -- an explicit string argument may be passed to LoadTable.) |
| v | Specifies the value array with all
labels and data to be displayed in the table. This data is entered
as a single-dimensional VBScript array, something which might seem
odd. I have, however, found that this is the cleanest way to
supply data. I would suggest that the array data be organized with
line breaks corresponding to the line breaks in the Excel table. Use null to represent empty cells. |
| ncol | Specifies the total number of columns in the table, including both label and data columns. |
| r | Specifies the range object for the table in the Excel file. |
| worksheet | is a global variable which specifies the name of the worksheet into which the table is to be written. (Specify a string identifier prior to calling LoadTable. It may be altered between calls to write tables to different worksheets. The worksheet parameter is ignored if the table range name is defined in the target worksheet. |
| ncdim | is a global variable indicating the number of "column dimensions". The default value of ncdim is one. This value should be set prior to calls to SetRange(ident,"columnlabel",r), as the number of column dimensions determines the number of label rows in the table. (See ex1.vbs for illustration of how this is used.) |
| nrdim | is a global variable indicating the number of "row dimensions". The default value of nrdim is one. This value should be set prior to calls to SetRange(ident,"rowlabel",r), as the number of row dimensions determines the number of label columns on the left side of the table. |
| fontname | Specifies the default font to be applied to the entire table (default "Times New Roman"). |
| pattern | Specifies the default range interior pattern. The default is "xlSolid" which removes spreadsheet cell boundaries. |
| columnwidth | Specifies the width of columns in the table. The default is 12. |
| colorindex | Specifies the color index of the interior cells of the table range. (The default index is 2.) |
Unzip the Windows Script File to a directory on the Windows path (the GAMS system directory, for example). Unzip the xltable examples to a new directory, open a command prompt in that directory and type run. This runs through each of the five illustrative command files shown below.
This project has primarily involved my learning the VBScript/Excel object model. At this point I can offer a pilot version of a libinclude wrapper, xltable.gms. This file and a test program (test.gms) are included in xltablexamples.zip. (NB: This routine relies upon the rdomain and cdomain utilities which described here and are included in inclib.pck.
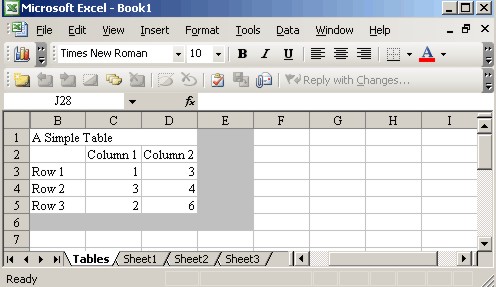
'       Simple table with no formatting, written to a new
'       workbook:

'  Define a table with three columns (including one row label and one
'  column label):

ncol=3
v=array(_
null,           "Column 1",     "Column 2", _
"Row 1",        1,              3, _
"Row 2",        3,              4, _
"Row 3",        2,              6  )

worksheet = "Tables"
call LoadTable("Simple","A Simple Table",v,ncol,r)
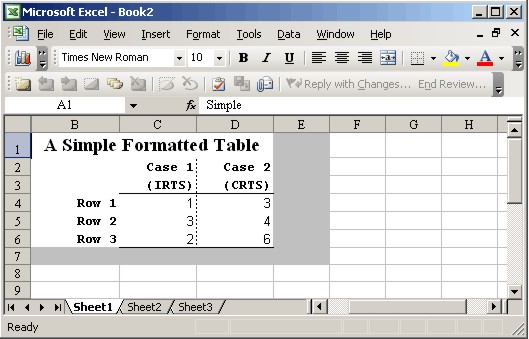
'       Simple example with default formatting:

ncol=3
v=array(_
null,           "Case 1",     "Case 2", _
null,           "(IRTS)",     "(CRTS)", _
"Row 1",        1,              3, _
"Row 2",        3,              4, _
"Row 3",        2,              6  )

call LoadTable("Simple","A Simple Formatted Table",v,ncol,r)

'       Format the output, taking into account that there
'       are two dimension labels at the top of each column:

ncdim = 2

'       These are the only controls offered for formatting
'       the aggregate table:

fontname = "Arial"
pattern = xlNone
columnwidth = 14
colorindex = 1
call DefaultFormat("Simple")
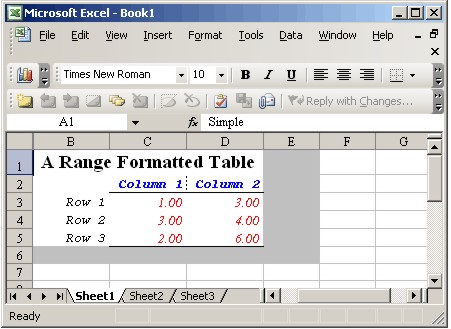
' Example illustrates customized formatting using
' the SetRange() routine to retrieve regions:
' Define a table with three columns (including one row label and one
' column label):
ncol=3
v=array(_
null, "Column 1", "Column 2", _
"Row 1", 1, 3, _
"Row 2", 3, 4, _
"Row 3", 2, 6 )
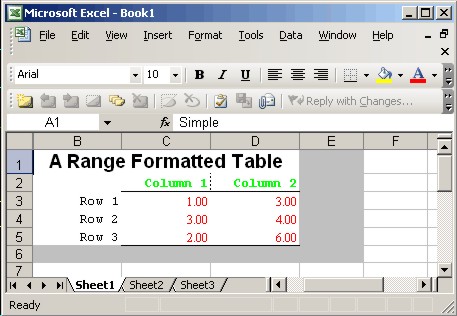
call LoadTable("Simple","A Range Formatted Table",v,ncol,r)
call DefaultFormat("Simple")
' Apply some additional formatting after having
' gone through the default:
call SetRange("Simple","range",r)
r.Font.Italic = True
call SetRange("Simple","data",r)
r.Borders(xlInsideVertical).LineStyle=xlnone
r.Font.Color = rgb(255,0,0)
r.NumberFormat = "0.00"
call SetRange("Simple","rowlabel",r)
r.Font.Bold = False
call SetRange("Simple","columnlabel",r)
r.Font.Color = rgb(0,0,255)
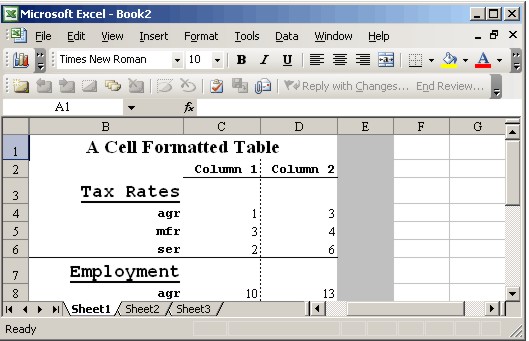
'       Example illustrates customized formatting using
'       the RangeSelect() routine to select specific cells:

'  Define a table with three columns (including one row label and one
'  column label):

ident = "custom"
ncol=3
v=array(_
null,           "Column 1",     "Column 2", _
"Tax Rates",    null,           null, _
"agr",          1,              3, _
"mfr",          3,              4, _
"ser",          2,              6, _
"Employment",   null,           null, _
"agr",          10,              13, _
"mfr",          33,              24, _
"ser",          21,              36)

Call LoadTable(ident,"A Cell Formatted Table",v,ncol,r)

Call DefaultFormat(ident)

Call RangeSelect(ident,3,1,3,1,r)
r.Font.Size = 14
r.Font.Bold = true
r.ColumnWidth = 25
r.Font.Underline = xlUnderlineStyleSingle

Call RangeSelect(ident,6,1,6,0,r)
r.Borders(xlEdgeBottom).LineStyle = xlContinuous
r.Borders(xlEdgeBottom).Weight = xlThin

Call RangeSelect(ident,7,1,7,1,r)
r.Font.Size = 14
r.Font.Bold = true
r.Font.Underline = xlUnderlineStyleSingle
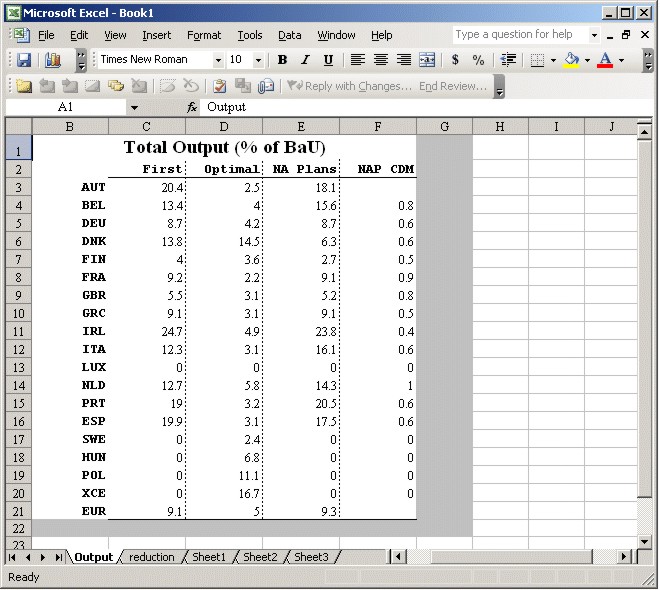
'       Generate a worksheet with two tables
dim ident, title

ident = "reduction"
title = "Total Emission Reduction (% of BaU)"
ncol=5
v=array(_
null,"First",      "Optimal",   "NA Plans",  "NAP CDM",_
null,"1",          "2",         "3",         "4",_
"AUT",2.040000E+01,2.500000E+00,1.810000E+01,null, _
"BEL",1.340000E+01,4.000000E+00,1.560000E+01,8.000000E-01,_
"DEU",8.700000E+00,4.200000E+00,8.700000E+00,6.000000E-01,_
"DNK",1.380000E+01,1.450000E+01,6.300000E+00,6.000000E-01,_
"FIN",4.000000E+00,3.600000E+00,2.700000E+00,5.000000E-01,_
"FRA",9.200000E+00,2.200000E+00,9.100000E+00,9.000000E-01,_
"GBR",5.500000E+00,3.100000E+00,5.200000E+00,8.000000E-01,_
"GRC",9.100000E+00,3.100000E+00,9.100000E+00,5.000000E-01,_
"IRL",2.470000E+01,4.900000E+00,2.380000E+01,4.000000E-01,_
"ITA",1.230000E+01,3.100000E+00,1.610000E+01,6.000000E-01,_
"LUX",0.000000E+00,0.000000E+00,0.000000E+00,0.000000E+00,_
"NLD",1.270000E+01,5.800000E+00,1.430000E+01,1.000000E+00,_
"PRT",1.900000E+01,3.200000E+00,2.050000E+01,6.000000E-01,_
"ESP",1.990000E+01,3.100000E+00,1.750000E+01,6.000000E-01,_
"SWE",0.000000E+00,2.400000E+00,0.000000E+00,0.000000E+00,_
"HUN",0.000000E+00,6.800000E+00,0.000000E+00,0.000000E+00,_
"POL",0.000000E+00,1.110000E+01,0.000000E+00,0.000000E+00,_
"XCE",0.000000E+00,1.670000E+01,0.000000E+00,0.000000E+00,_
"EUR",9.100000E+00,5.000000E+00,9.300000E+00,null)

'       Place the data in worksheet with the same name:
worksheet = ident
call LoadTable(ident,title,v,ncol,r)

'       Define the non-default column dimension:

ncdim=2

'       Apply default formatting:

call DefaultFormat(ident)

'       Adjust the row label formatting:

call SetRange(ident,"rowlabel",r)
r.Font.Bold = False

ident = "Output"
title = "Total Output (% of BaU)"
ncol=5
v=array(_
null,"First",      "Optimal",   "NA Plans",  "NAP CDM",_
"AUT",2.040000E+01,2.500000E+00,1.810000E+01,null, _
"BEL",1.340000E+01,4.000000E+00,1.560000E+01,8.000000E-01,_
"DEU",8.700000E+00,4.200000E+00,8.700000E+00,6.000000E-01,_
"DNK",1.380000E+01,1.450000E+01,6.300000E+00,6.000000E-01,_
"FIN",4.000000E+00,3.600000E+00,2.700000E+00,5.000000E-01,_
"FRA",9.200000E+00,2.200000E+00,9.100000E+00,9.000000E-01,_
"GBR",5.500000E+00,3.100000E+00,5.200000E+00,8.000000E-01,_
"GRC",9.100000E+00,3.100000E+00,9.100000E+00,5.000000E-01,_
"IRL",2.470000E+01,4.900000E+00,2.380000E+01,4.000000E-01,_
"ITA",1.230000E+01,3.100000E+00,1.610000E+01,6.000000E-01,_
"LUX",0.000000E+00,0.000000E+00,0.000000E+00,0.000000E+00,_
"NLD",1.270000E+01,5.800000E+00,1.430000E+01,1.000000E+00,_
"PRT",1.900000E+01,3.200000E+00,2.050000E+01,6.000000E-01,_
"ESP",1.990000E+01,3.100000E+00,1.750000E+01,6.000000E-01,_
"SWE",0.000000E+00,2.400000E+00,0.000000E+00,0.000000E+00,_
"HUN",0.000000E+00,6.800000E+00,0.000000E+00,0.000000E+00,_
"POL",0.000000E+00,1.110000E+01,0.000000E+00,0.000000E+00,_
"XCE",0.000000E+00,1.670000E+01,0.000000E+00,0.000000E+00,_
"EUR",9.100000E+00,5.000000E+00,9.300000E+00,null)

'       Place the data in a separte worksheet:

worksheet = ident
call LoadTable(ident,title,v,ncol,r)
call DefaultFormat(ident)
'       Example illustrates customized formatting using
'       the .offset() method to define subregions:

ncol=3
v=array(_
null,           "Column 1",     "Column 2", _
"Row 1",        1,              3, _
"Row 2",        3,              4, _
"Row 3",        2,              6  )

call LoadTable("Simple","A Range Formatted Table",v,ncol,r)
call DefaultFormat("Simple")

'       Apply some additional formatting after having
'       gone through the default:

dim ndrow,ndcol,datarange,rowlabels,collabels
ndrow = r.rows.count-1
ndcol = r.columns.count-1

set datarange=r.offset(1,1).resize(ndrow,ndcol)
set rowlabels=r.offset(1,0).resize(ndrow,1)
set collabels=r.offset(0,1).resize(1,ndcol)

MsgBox  "Data:"&datarange.Address&vbCRLf&_
        "Row Labels:"&rowlabels.Address&vbCRLf&_
        "Column Labels:"&collabels.Address&vbCRLf

'       Format the data range:

with datarange
   .Borders(xlInsideVertical).LineStyle=xlnone
   .Font.Color = vbRed
   .NumberFormat = "0.00"
end with

'       Format the row labels:

with rowlabels
   .Font.Bold = False
   .HorizontalAlignment = xlRight
end with

'       Format the column headers:

with collabels
   .Font.Color = vbGreen
end with
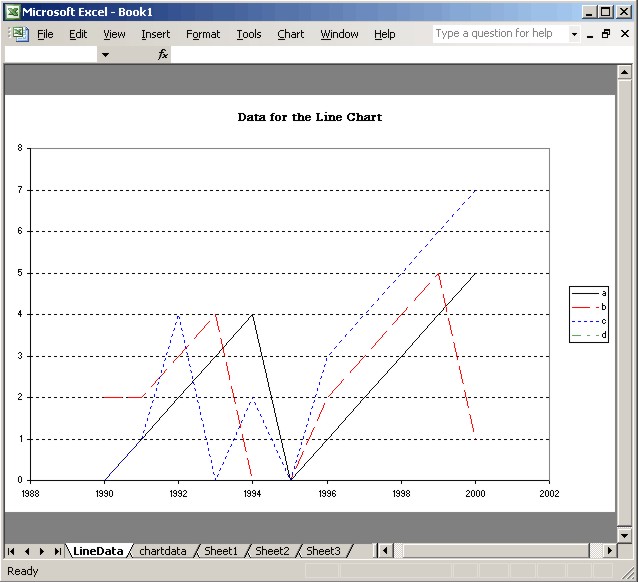
'	Generate a line chart using the LineChart() routine:

ncol=5
v=array(_
null,"a","b","c","d",_
1990,0,2,0,0,_
1991,1,2,1,0,_
1992,2,3,4,0,_
1993,3,4,0,0,_
1994,4,0,2,0,_
1995,0,0,0,0,_
1996,1,2,3,0,_
1997,2,3,4,0,_
1998,3,4,5,0,_
1999,4,5,6,0,_
2000,5,1,7,0)
worksheet="chartdata"
Call LoadTable("LineData","Data for the Line Chart",v,ncol,r)
call DefaultFormat("LineData")
call LineChart("LineData")
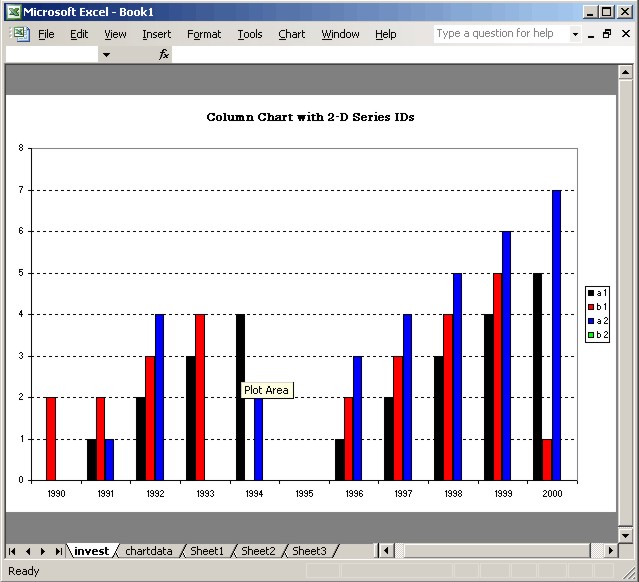
'	Generate a histogram chart using the HISTOGRAM routine
ncol=5
v=array(_
null,"a","b","a","b",_
null,"1","1","2","2",_
1990,0,2,0,0,_
1991,1,2,1,0,_
1992,2,3,4,0,_
1993,3,4,0,0,_
1994,4,0,2,0,_
1995,0,0,0,0,_
1996,1,2,3,0,_
1997,2,3,4,0,_
1998,3,4,5,0,_
1999,4,5,6,0,_
2000,5,1,7,0)
worksheet="chartdata"
Call LoadTable("invest","Column Chart with 2-D Series IDs",v,ncol,r)
ncdim = 2
call DefaultFormat("invest")
call Histogram("invest")
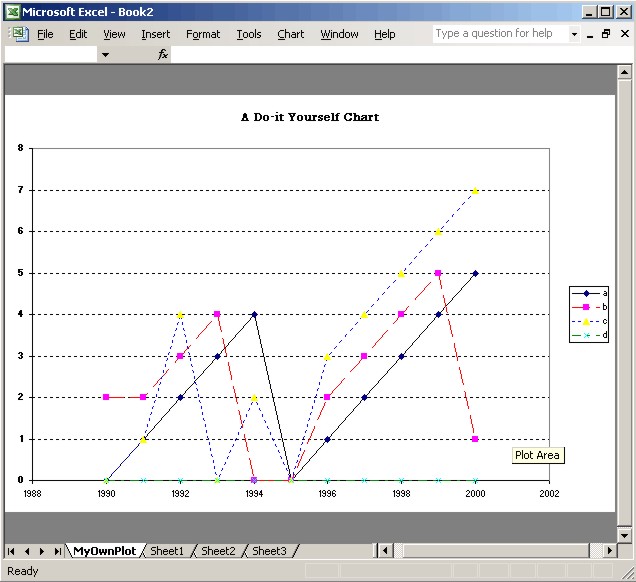
'	Do it yourself charting (no series customization)

ncol=5
v=array(_
null,"a","b","c","d",_
1990,0,2,0,0,_
1991,1,2,1,0,_
1992,2,3,4,0,_
1993,3,4,0,0,_
1994,4,0,2,0,_
1995,0,0,0,0,_
1996,1,2,3,0,_
1997,2,3,4,0,_
1998,3,4,5,0,_
1999,4,5,6,0,_
2000,5,1,7,0)
Call LoadTable("plotdata","A Cell Formatted Table",v,ncol,r)

With objwb.charts.add
   .SetSourceData r,xlColumns
   .ChartType = xlXYScatterLines
End With
With objwb.ActiveChart.Axes(xlValue).TickLabels
   .Font.Bold = True
   .NumberFormat = "0"
End With
With objwb.ActiveChart
   .name = "MyOwnPlot"
   .HasTitle = True
   .ChartTitle.Text = "A Do-it Yourself Chart"
   .Deselect
End With
These responses will import the entire workbook. After having made the link you can edit the link to include only one table rather than the entire Excel workbook.
Enter the menu commands Edit Links. This opens a dialogue in which you can highlight your previously defined selection and press the "Change Source" button. This opens a second dialogue (file selection) in which you can navigate to the workbook file.
Before inserting the file be sure to press the Item button. This opens a simple dialogue which states: "Type the bookmark name or range of Microsoft Excel cells you want to insert." You may then enter the named range from which the table is to be inserted. After having reimported the link, you will be left only a single table in your Word document.
<?xml version="1.0" ?>
<job>
<reference guid="{00020813-0000-0000-C000-000000000046}"/>
<!--comment
Script: xltable.wsf
Inserts formatted tables and charts in Excel from flat file input.
-->
<script language="VBScript">
<![CDATA[
Option Explicit
dim ExcelRunning ' Logical switch : Excel is running
dim batch ' Logical flag for batch operation (no message boxes)
dim row ' Integer index of last row written
dim objxl,objwb,objws ' Objects referring to Excel
dim ncol ' Number of columns in user-provided data (including labels)
dim v ' Array with user data
dim nrdim,ncdim ' Number of dimensions on rows and columns of table
dim workbook ' Name of the workbook
dim worksheet ' Name of the worksheet to be written
dim r ' Range identifier
dim cmdfile ' Name (including path) for user command file
dim oFile ' Unit number of the user command file
dim logFile ' Unit number of the log file (xltable.log)
' Global formatting switches:
dim fontname,pattern,columnwidth,colorindex
fontname ="Times New Roman"
pattern = xlSolid
columnwidth = 12
colorindex = 2
batch = False
call OpenFiles
' Current row:
row = 1
objwb.Activate
On Error Goto 0
' Read the user-specified code:
If Include(cmdfile)<>0 then
If not batch Then
If not ExcelRunning Then objxl.Quit
Call ErrMsg("Error encountered in command file. Message code:"&cstr(retcode))
End If
End If