


|
|
|
* This software is not officially supported by GAMS Corporation.
ShadeMap is a tool for shading or colouring regions of simple maps which has been created by Mark Horridge. This program has a web page and a Windows help file. Mark's program can be called from GAMS to produce maps on the screen colored with data at execution time. Here is a screen shot of the program output:
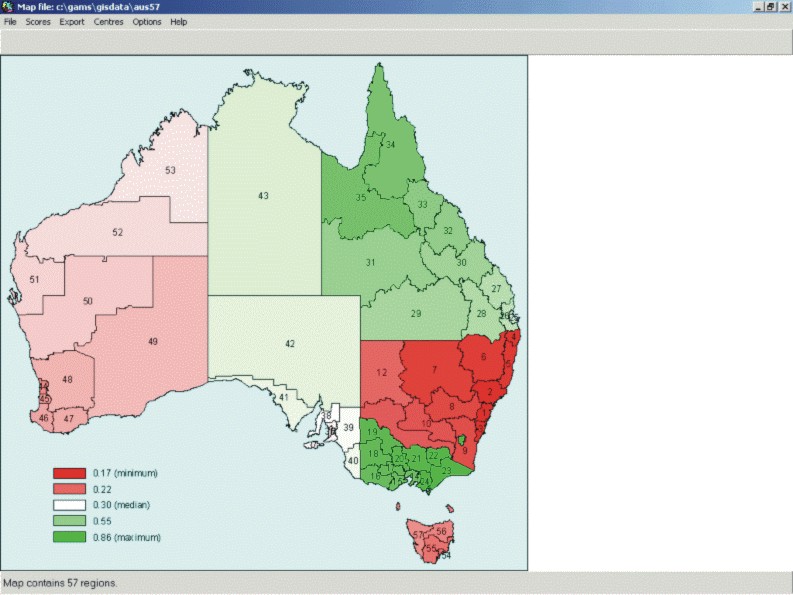
The program can be invoked from within GAMS using an execute statement. Inputs for SHADEMAP are text files, so it is a simple matter to use PUT statements to write out your GAMS program data, and then issue an EXECUTE statement to plot the resulting map. This web page describes a "GAMS libinclude wrapper" for Mark's program.
[$SETGLOBAL shademapopts "setid"]
$LIBINCLUDE shademap [ mapid values [ mapping ] ]
In this routine mapid corresponds to a pair of MID/MIF files for the map to be shaded, and values provides values to be assigned to regions in the map. When provided, mapping provides a two-dimensional set which provides a correspondence between set elements in the values array and region identifiers in mapid.
Some additional information:
(i) The SHADEMAP libinclude routine requires both a mapid.MID and mapid.MIF file for the map to be displayed. The mapid.MID file provides identifiers for regions in the model.
(ii) The mapid.MID and mapid.MIF files may either be included in the working directory or they may be included in the gisdata folder in the GAMS system directory.
(iii) Use a blank invocation (without arguments) to initialize.
(iv) The environment variable shademapopts can be used to control how the map is displayed by writing an options file for Mark's program.
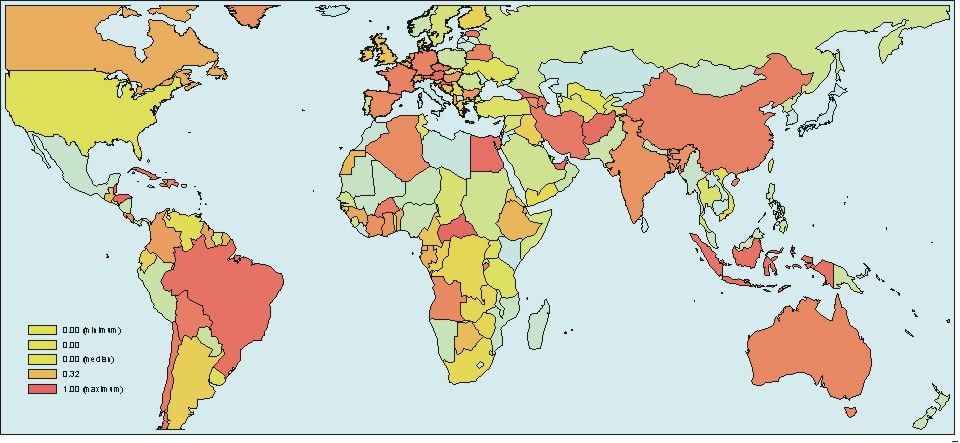
set r /
$include %gams.sysdir%gisdata\global.mid
/;

parameter v(r)  Random values;
v(r) = uniform(0,1);

$libinclude shademap  global v
This program produces the following map:
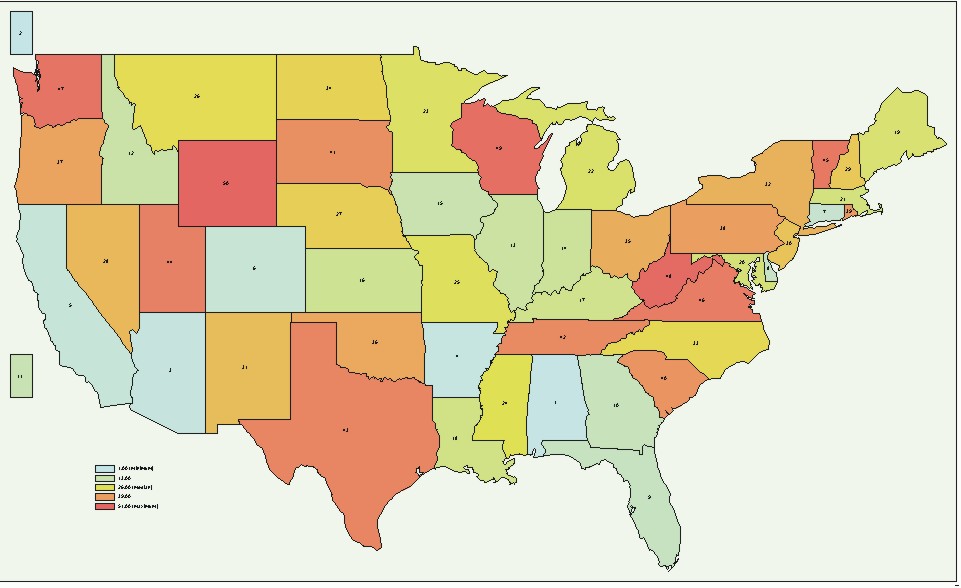
set	mid_r  Region identifiers in the GIS data files /
Alabama, Alaska, Arizona, Arkansas, California, Colorado, Connecticut,
Delaware, Florida, Georgia, Hawaii, Idaho, Illinois, Indiana, Iowa,
Kansas, Kentucky, Louisiana, Maine, Maryland, Massachusett, Mitchigan,
Minnesota, Mississippi, Missiouri, Montana, Nebraska, Nevada,
NewHampshire, NewJersey, NewMexico, NewYork, NthCarolina, NorthDakota,
Ohio, Oklahoma, Oregon, Pennsylvania, RhodeIsland, SthCarolina,
SouthDakota, Tennessee, Texas, Utah, Vermont, Virginia, Washington,
WestVirginia, Wisconsin, Wyoming, DistColumbia/;

set	r  Regions identifiers in the GAMS program /
AK,AL,AR,AZ,CA,CO,CT,DC,DE,FL,GA,HI,IA,ID,IL,IN,KS,KY,LA,MA,MD,ME,MI,MN,MO,MS,
MT,NC,ND,NE,NH,NJ,NM,NV,NY,OH,OK,OR,PA,RI,SC,SD,TN,TX,UT,VA,VT,WA,WI,WV,WY/;

set	mapr(r,mid_r)	Mapping from GAMS labels to GIS	labels /
AK.Alaska,AL.Alabama,AR.Arkansas,AZ.Arizona,CA.California,CO.Colorado,
CT.Connecticut,DC.DistColumbia,DE.Delaware,FL.Florida,GA.Georgia,HI.Hawaii,
IA.Iowa,ID.Idaho,IL.Illinois,IN.Indiana,KS.Kansas,KY.Kentucky,LA.Louisiana,
MA.Massachusett,MD.Maryland,ME.Maine,MI.Mitchigan,MN.Minnesota,MO.Missiouri,
MS.Mississippi,MT.Montana,NC.NthCarolina,ND.NorthDakota,NE.Nebraska,
NH.NewHampshire,NJ.NewJersey,NM.NewMexico,NV.Nevada,NY.NewYork,OH.Ohio,
OK.Oklahoma,OR.Oregon,PA.Pennsylvania,RI.RhodeIsland,SC.SthCarolina,
SD.SouthDakota,TN.Tennessee,TX.Texas,UT.Utah,VA.Virginia,VT.Vermont,
WA.Washington,WI.Wisconsin,WV.WestVirginia,WY.Wyoming /;

parameter v(r)  Random values;
v(r) = ord(r);

$libinclude shademap usa v mapr
This program produces the following map:
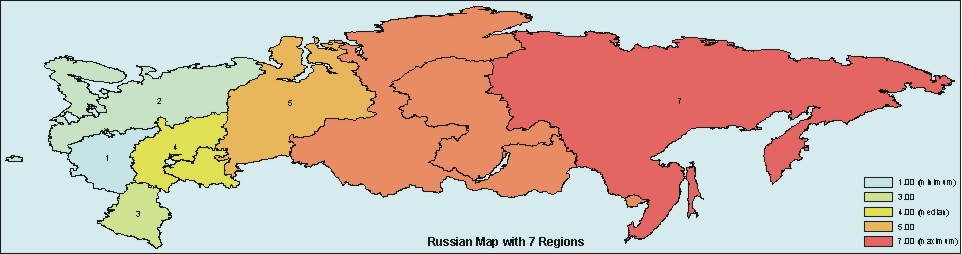
set d	Districts /
	cen	Central Federal Okrug (Moscow),
	nor	North-West Federal Okrug (St. Petersberg),
	sou	South Federal Okrug (Rstov-on-Don)
	pvl	Provlzhsky Federal Okrug (Volga)
	ura	Urals Federal Okrug (Ekaterinburg),
	sib	Siberia Federal Okrug (Novosibirsk)
	far	Far-East Federal Okrug (Khabarovsk) /;


parameter	v(d)	Values;

v(d) = ord(d);

$eolcom !
set mapopt7 /
	title	 "Russian Map with 7 Regions"
	titlepos 50 95
	yytrans 120  ! Stretch map vertically (80..120, 100=no stretch) [Integer]
	LegendPos 90 70  ! Color key position: Left,Top as % of Map size (10..90) [2 integers]
/;
$set shademapopts mapopt7
$libinclude shademap russia7  v
This program produces the following map:
Economics Department, University of Colorado, Boulder CO
80309-0256
Created May, 2004 by TFR