* This research supported by the GAMS Applied General Equilibrium Research Fund. I would like to thank Michael Ferris and Miles Light for their suggestions on the original development work interfacing GAMS and GNUPLOT. It would be misleading if I did not acknowledge that Ferris prefers to use MATLAB for visualization. The author remains responsible for any bugs which exist in this software. This software is not officially supported by GAMS Corporation.
There has been a renewed interest in GNUPLOT in the past few years, and Tatsuro Matsuoka has kindly released a new build of gnuplot 4.7 (CVS) for Windows. If you wish to get Tatsuro's most recent files, they are on his web page. The version I have used for development is gp470-win32-mingw.
My implementation of GNUPLOT is based on the idea that the wherever possible the user provides "native GNUPLOT instructions". This produces a very thin interface and the user to decide how closely she wishes to study the GNUPLOT frequently asked questions, the manual and online documentation. This interface is design so that when a plot is generated from GAMS, the user is presented with a GNUPLOT command window in which she can revise the figure and issue replot commands. Furthermore, the GNUPLOT command and data files are saved for subsequent enhancement. This system makes it quite simple to move from quick diagnostic output to publication-quality figures.
As has been the case since my previous release the libinclude interface is called PLOT.
My GNUPLOT graph did not appear. How do I debug?
The libinclude routine write files in the local directory, gp_xxx.gpl and gp_xxx.dat. These contain a GNUPLOT command file and data. You can invoke WGNUPLOT as a separate process and load the command file in order to see the GNUPLOT error message.
How do I represent missing values?
PLOT.GMS uses use the special GAMS numeric value "NA" to represent missing data. (See ex5.gms.)
Can I regenerate a plot using GNUPLOT independent of GAMS?
Yes. If you look at your command file after GAMS has exited, you will find that these contain all the GNUPLOT commands and data required to generate the last plot from your GAMS code. To reproduce the graph, open the GNUPLOT command file within WGNUPLOT.
1. A PC with Windows (perhaps Linux?)
2. A recent version of GAMS, available from:
GAMS Development Corp., 1217 Potomac Street NW, Washington DC 20007
Phone: (202) 342 0180, Fax: (202) 342 0181
email:steve@gams.com
In GAMS, an environment variable is set with a statement such as:
$setglobal variable value
This passes a variable with a specified value to GNUPLOT. The following variables are understood:
| domain | Specifies the domain on the x-axis of data which are to be displayed. (Note: this parameter may be specified as the second argument on the $libinclude call.) |
| series | Specifies the data series (individual output plots) which are to be displayed. (Note: this parameter may be specified as the third argument on the $libinclude call.) |
| labels | Subset of X axis labels to be displayed on graph. |
| xvalue | Specifies a parameter or column containing the x-axis values -- included to permit generating graphs with unequal intervals. (The package first looks to see if there is a parameter named %xvalue%. If there is no parameter with that name, it then looks for a datacolumn with that name.) |
| batch | Specifying $setglobal batch yes indicates that GNUPLOT should be called in batch mode. |
| gp_file | Optional switch which can be used
to archive the GNUPLOT command and data files. For example,
specifying:
$setglobal gp_file myplotindicates that the GNUPLOT command file should be written to myplot.gpl and the GNUPLOT data file should be written to myplot.dat. |
$title  Example 0: Plot a one dimensional vector to the screen

set t /1990*2030/;

parameter a(t)  Example 0: Generic output to the screen (default invocation);
a("1990") = 1;
loop(t,  a(t+1) = a(t) * (1 + 0.04 * uniform(0.2,1.8)); );

*        I know that a() is defined over set t.  The plotting package
*       knows that the argument has one dimension, but it does not know
*       what set defines those entry.  Three ways to pass the domain:

*       (i) Let GAMS figure out which elements of A are nonzero (not a problem
*       here because the parameter is dense:

$libinclude plot A

$exit

*	Alternative invocations:

*       (ii) Pass GAMS the domain on the call:

$libinclude plot A t

*       (iii) Pass GAMS the domain in an environment vaiable:

$setglobal domain t
$libinclude plot A
$title  Example 1: Generic Invocation of GNUPLOT


set t /1990*2030/, j /a,b,c,d/;

parameter a(t,j)  Example 1: Generic output to the screen (default invocation);
a("1990",j) = 1;
loop(t,  a(t+1,j) = a(t,j) * (1 + 0.04 * uniform(0.2,1.8)); );

$setglobal gp_opt1 'set key top left'
$libinclude plot A
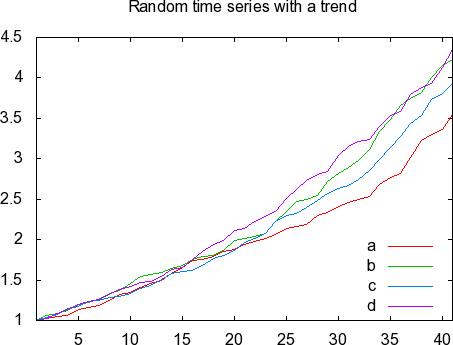
$title  Example 2: Directing GNUPLOT Output to File

set t /1990*2030/, j /a,b,c,d/;

parameter a(t,j)  Random time series with a trend;
a("1990",j) = 1;
loop(t,  a(t+1,j) = a(t,j) * (1 + 0.04 * uniform(0.2,1.8)); );

$setglobal gp_opt1 'set key bottom right'
$setglobal gp_opt2
$setglobal gp_opt3
$libinclude plot A

*	Shift into a batch format:

$setglobal batch yes

*       Generate a high-resolution image using the TIKZ terminal:

$setglobal gp_opt2 "set term lua tikz fulldoc createstyle"
$setglobal gp_opt3 "set output 'a.tex'"
$setglobal gp_file a_tikz
$libinclude plot A
execute 'pdflatex a.tex';


$setglobal gp_opt2 'set term png crop'
$setglobal gp_opt3 "set output 'ex2_37.png'"
$setglobal gp_opt7 "set size 0.8,0.8"
$libinclude plot A
The PNG file generated by ex2.gms:
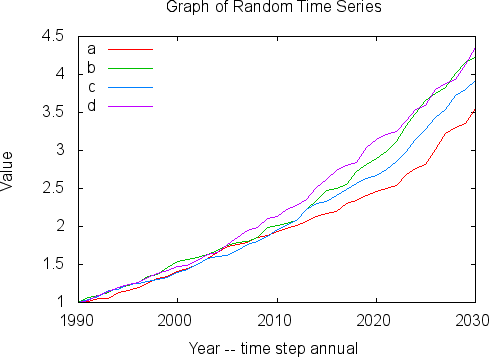
$title  Example 3: Graphs with Labels and Titles

set t /0*40/, j /a,b,c,d/;

*       Note: where we specify descriptive text for subset elements,
*       it is then displayed in place of the subset index on the
*       graph -- i.e. 1990,2000 etc. are displayed, not 0,10,...

set decade(*) / 0 1990, 10 2000, 20 2010, 30 2020, 40 2030/;

parameter a(t,j)  Example 3: Labels and Titles;
a("0",j) = 1;
loop(t,  a(t+1,j) = a(t,j) * (1 + 0.04 * uniform(0.2,1.8)); );

*       ---------------------------
*       Generic plotting commands:

$setglobal labels decade


$setglobal gp_opt5 "set xlabel 'Year -- time step annual'"
$setglobal gp_opt6 "set ylabel 'Value'"


*       ---------------------------
*       GNUPLOT commands:

$setglobal gp_opt1 "set key at 5,3"
$setglobal gp_opt2 "set title 'Graph of Random Time Series'"
$libinclude plot A

$setglobal batch yes
$setglobal gp_opt1 "set key left"
$setglobal gp_opt3 "set output 'ex3_37.png'"
$setglobal gp_opt4 "set term png crop"
$setglobal gp_opt7 "set size 0.8,0.8"
$libinclude plot A
The PNG file generated by ex3.gms:
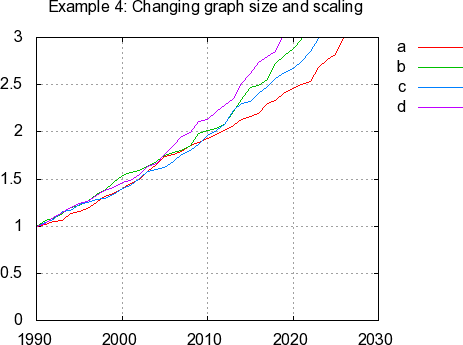
$title  Example 4: Changes the graph size, y range and location of key:

set t /1990*2030/, j /a,b,c,d/;

set decade(*) / 1990, 2000, 2010, 2020, 2030/;

parameter a(t,j)  Example 4: Changing graph size and scaling ;
a("1990",j) = 1;
loop(t,  a(t+1,j) = a(t,j) * (1 + 0.04 * uniform(0.2,1.8)); );

$setglobal labels decade

$setglobal gp_opt5 "set xlabel 'Year -- time step annual'"
$setglobal gp_opt6 "set ylabel 'Value'"

$setglobal gp_opt1 "set size 0.8,0.8"
$setglobal gp_opt2 "set key  outside right"
$setglobal gp_opt3 "set grid"
$setglobal gp_opt4 "set yrange [0:3]"
$libinclude plot A

$setglobal batch yes
$setglobal  gp_opt5 "set output 'ex4_37.png'"
$setglobal  gp_opt6 "set term png crop"
$libinclude plot A
The PNG file generated by ex4.gms:
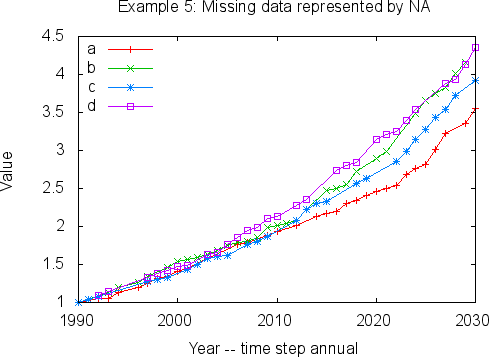
$title  Example 5: Unequally spaced data

set t /1990*2030/, j /a,b,c,d/;
parameter a(t,j)  Example 5: Missing data represented by NA;
a("1990",j) = 1;
loop(t,  a(t+1,j) = a(t,j) * (1 + 0.04 * uniform(0.2,1.8)); );

set decade(*) / 1990, 2000, 2010, 2020, 2030/;
parameter year(*); year(t) = 1989 + ord(t);

* Omit some data points randomly, indicating these as missing
* by assigning values equal to na:

a(t,j)$(uniform(0,1) le 0.25) = na;

$setglobal labels decade
$setglobal xvalue year

$setglobal gp_opt1 "set key at 1995,2"
$setglobal gp_opt2 "set style data linespoints"
$setglobal gp_opt3 "set xlabel 'Year -- time step annual'"
$setglobal gp_opt4 "set ylabel 'Value'"
$libinclude plot A

$setglobal batch yes

$setglobal gp_opt1 "set key left"
$setglobal gp_opt5 "set size 0.8,0.8"
$setglobal gp_opt6 "set output 'ex5_37.png'"
$setglobal gp_opt7 "set term png crop"
$libinclude plot A
The PNG file generated by ex5.gms:
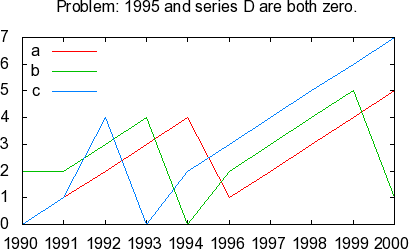
$title Example 6: Dealing with Zero Rows and Zero Columns
set i evaluation points /1990*2000/
j various time seris /a, b, c, d/;
$setglobal labels i
table time_path(i,j) Time series with holes
a b c d
1990 0 2 0 0
1991 1 2 1 0
1992 2 3 4 0
1993 3 4 0 0
1994 4 0 2 0
1995 0 0 0 0
1996 1 2 3 0
1997 2 3 4 0
1998 3 4 5 0
1999 4 5 6 0
2000 5 1 7 0;
* Note that time series d is all zeros, and
* all of the time series equals zero in 1995.
* Problem: Get gnuplot.gms to pass zero files
* through to the plotting package.
$setglobal gp_opt1 "set size 0.7,0.6"
$setglobal gp_opt2 "set key top left"
$setglobal gp_opt3 "set title 'Problem: 1995 and series D are both zero.'"
$libinclude plot time_path
$setglobal batch yes
$setglobal gp_opt4 "set term png crop"
$setglobal gp_opt5 "set output 'ex6a_37.png'"
$libinclude plot time_path
$setglobal gp_opt4
$setglobal gp_opt5
$setglobal batch no
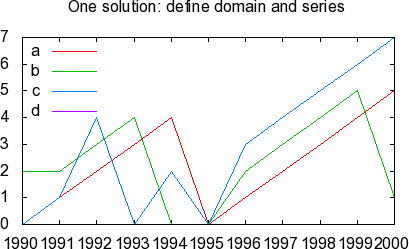
* Define an explicit domain and series:
$setglobal domain i
$setglobal series j
$setglobal gp_opt3 "set title 'One solution: define domain and series'"
$libinclude plot time_path
$setglobal batch yes
$setglobal gp_opt4 "set term png crop"
$setglobal gp_opt5 "set output 'ex6b_37.png'"
$libinclude plot time_path
$setglobal gp_opt4
$setglobal gp_opt5
$setglobal batch no
* Drop the domain and series definition:
$setglobal domain
$setglobal series
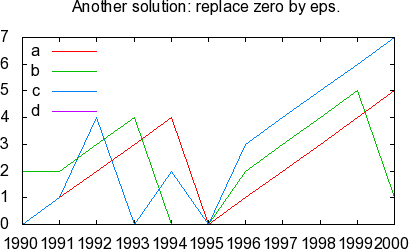
* Method 2: replace zero by eps
time_path(i,j)$(not time_path(i,j)) = eps;
$setglobal gp_opt3 "set title 'Another solution: replace zero by eps.'"
$libinclude plot time_path
$setglobal batch yes
$setglobal gp_opt4 "set term png crop"
$setglobal gp_opt5 "set output 'ex6c_37.png'"
$libinclude plot time_path
$setglobal gp_opt4
$setglobal gp_opt5
$setglobal batch no
PNG files generated by ex6.gms:
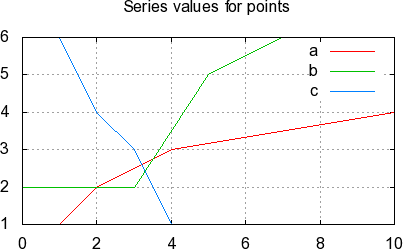
$title Example 7: Plotting Multiple Independent Series

set             i       observation counts /1*4/,
                g       graphs /a, b, c/;

table data(i,*,g)

        x.a     y.a     x.b     y.b     x.c     y.c
1       1       1       0       2       1       6
2       2       2       3       2       2       4
3       4       3       5       5       3       3
4       10      4       7       6       4       1;

*       First define a set which can hold 4 observations x
*       3 plot series:

set     p       plot points /1*12/

set pp(p);

pp("1") = yes;

parameter       x       X coordinate for a given point,
                y       Series values for points;


*       The next statement is crucial -- initialize
*       all plot points to NA (missing).  The package
*       will then only plot those items which are
*       specified.

y(p,g) = na;
loop(g,
        loop(i,
          x(pp)   = data(i,"x",g);
          y(pp,g) = data(i,"y",g);
          pp(p+1)$pp(p) = yes;
          pp(p)$pp(p+1) = no;
        );
);
display x, y;

$setglobal domain p
$setglobal xvalue x

$setglobal gp_opt1 "set grid"
$setglobal gp_opt2 "set tics"

$libinclude plot y


*       The X coordinates may also be passed as a column in the matrix.

y(p,"xv") = x(p);

$setglobal xvalue xv
$libinclude plot y

$setglobal batch yes
$setglobal gp_opt3 "set size 0.7,0.6"
$setglobal gp_opt4 "set term png crop"
$setglobal gp_opt5 "set output 'ex7_37.png'"
$libinclude plot y
PNG file generated by ex7.gms:
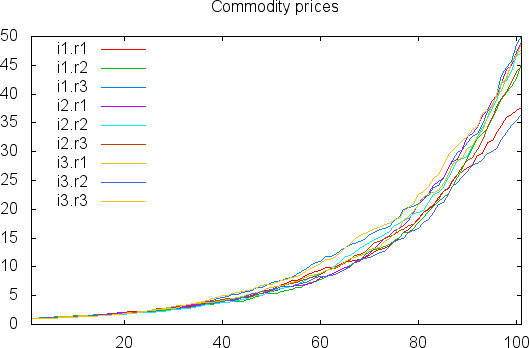
$title Example 8: Plotting Two-Dimensional Series

set     i       Commodities     /i1*i3/,
        r       Regions         /r1*r3/,
        t       Time periods    /2000*2100/
        s(i,r)  Plot series;

s(i,r) = yes;

parameter       prices(t,i,r)   Commodity prices;


prices(t,i,r) = 1;
loop(t,  prices(t+1,i,r) = prices(t,i,r) * (1 + 0.04 * uniform(0.2,1.8)); );

$setglobal gp_opt1 'set key top left'
$setglobal series s
$libinclude plot prices


$setglobal batch yes
$setglobal gp_opt2 "set size 0.9,0.8"
$setglobal gp_opt3 "set term png crop"
$setglobal gp_opt4 "set output 'ex8_37.png'"
$libinclude plot prices
PNG file generated by ex8.gms:
$if not setglobal debug $offlisting offinclude $if not set batch $set batch $if not setglobal batch $set batch $if "%batch%"==no $set batch $if "%batch%"==NO $set batch *----------------------------------------------------------------------------- * GAMS Source Code (resides in the ldir directory): GNUPLOT Plotting Routine *----------------------------------------------------------------------------- * $setglobal domain * $setglobal labels * $setglobal xvalue * $setglobal gp_file * $libinclude plot- $if not set gp_count $set gp_count 0 $eval gp_count %gp_count%+1 $log gp_count=%gp_count% $setglobal gp_count %gp_count% *----------------------------------------------------------------------------- * Declarations: *----------------------------------------------------------------------------- $if not declared gp__1 alias(gp__1,gp__2,*); $if not declared gp_row set gp_row(*), gp_col(*); $if not declared gp_r parameter gp_r(*); $if not declared gp_rr alias (gp_rr,gp_row); $if not declared gp_na scalar gp_na /na/; $if not declared gp_count scalar gp_count, gp_counter; * Update command and data file names for current invocation: $set cmd gp_cmd%gp_count% $set dat gp_dat%gp_count% $set file gp_%gp_count% $if setglobal gp_file $set file %gp_file% $if "%gp_file%"=="" $set file gp_%gp_count% $setglobal gp_file execute 'if exist %file%.plt del %file%.plt'; execute 'if exist %file%.dat del %file%.dat'; file %cmd% /%file%.plt/; file %dat% /%file%.dat/; * If no arguments, this is solely for intialization: $if a%1 == a $exit $if declared %1 $goto declared $error PLOT ERROR: Identfier %1 is not declared. $exit $label declared $if defined %1 $goto defined $error PLOT ERROR: identfier %1 is not defined. $exit $label defined $if not setglobal domain $setglobal domain $if not setglobal series $setglobal series $if not "%2"=="" $setglobal domain %2 $onuni $if dimension 1 %1 $goto start1 $if not "%3"=="" $setglobal series %3 $if dimension 2 %1 $goto getsets $if not %series%=="" $goto getsets $error PLOT error: series must be specified for multidimensional plots $exit * Extract row and column labels: $label start1 gp_row(gp__1)$%1(gp__1) = yes; $label getsets $if not dimension 1 %1 $goto arraysets $if "%domain%"=="" gp_row(gp__1)$abs(%1(gp__1)) = yes; $if not "%domain%"=="" gp_row(%domain%) = yes; $goto checkx $label arraysets $if not "%domain%"=="" $goto getseries $if %series%=="" gp_row(gp__1)$sum(gp__2, abs(%1(gp__1,gp__2))) = yes; $if not %series%=="" gp_row(gp__1)$sum(%series%, abs(%1(gp__1,%series%))) = yes; $label getseries $if "%series%"=="" gp_col(gp__2)$sum(gp__1, abs(%1(gp__1,gp__2))) = yes; $if not "%domain%"=="" gp_row(%domain%) = yes; $if not dimension 2 %1 $goto checkx $if not "%series%"=="" gp_col(%series%) = yes; * See if xvalue has been specified: $label checkx $if setglobal xvalue $goto xvalue * 1. No X parameter array has been specified assign unit values: gp_count = 1; loop(gp_row, gp_r(gp_row) = gp_count; gp_count = gp_count + 1; ); $goto write $label xvalue * If the plotted item is single dimensional, skip * we must assume that xvalue is a parameter: $if partype %xvalue% $goto xparam $if dimension 2 %1 $goto xcolumn $error PLOT ERROR: Cannot find parameter %xvalue% (xvalue). $exit * 2. X parameter values are in the data array: $label xcolumn gp_r(gp_row) = %1(gp_row,"%xvalue%"); gp_col("%xvalue%") = no; $goto write * 3. X values are in a separate array: $label xparam $if partype %xvalue% $goto gotparam $abort Unrecognized symbol specified as xvalue in plot call: %xvalue% $label gotparam gp_r(gp_row) = %xvalue%(gp_row); $label write put %cmd%; file.lw = 0; file.nr = 0; file.nd = 0; file.nw = 6; put '# Plotting item %1'/; put 'set title "',%1.ts,'"'/; $if set title put 'set title %title%'/; $if not setglobal xvalue put 'set xrange [1:',card(gp_row),']'/; %cmd%.nd = 3; %cmd%.nw = 12; $if setglobal xvalue put 'set xrange [',(smin(gp_row,gp_r(gp_row))),':',(smax(gp_row,gp_r(gp_row))),']'/; $if not setglobal labels $goto options put 'set xtics ('; %cmd%.nd = 3; %cmd%.nw = 12; gp_count = 0; gp_counter = 0; loop(gp_row, gp_count=gp_count+1; if (%labels%(gp_row), gp_counter = gp_counter + 1; if (gp_counter gt 1, put ',';); $if not setglobal xvalue put '\'/' "',%labels%.te(gp_row),'" ',gp_count; $if setglobal xvalue put '\'/' "',%labels%.te(gp_row),'" ',%xvalue%(gp_row); ); ); put ')'/; * Pass through any user-specified options: $label options put 'set style data lines'/; * Permit user-override of up to 10 GNUPLOT features: $set wtitle WGNUPLOT %file%.plt -- Enter alt-F4 to close window. put 'set term windows title "%wtitle%"'/; $if setglobal gp_opt0 put "%gp_opt0%"/; $if setglobal gp_opt1 put "%gp_opt1%"/; $if setglobal gp_opt2 put "%gp_opt2%"/; $if setglobal gp_opt3 put "%gp_opt3%"/; $if setglobal gp_opt4 put "%gp_opt4%"/; $if setglobal gp_opt5 put "%gp_opt5%"/; $if setglobal gp_opt6 put "%gp_opt6%"/; $if setglobal gp_opt7 put "%gp_opt7%"/; $if setglobal gp_opt8 put "%gp_opt8%"/; $if setglobal gp_opt9 put "%gp_opt9%"/; $if setglobal gp_opt10 put "%gp_opt10%"/; $if setglobal gp_opt11 put "%gp_opt11%"/; $if setglobal gp_opt12 put "%gp_opt12%"/; $if setglobal gp_opt13 put "%gp_opt13%"/; $if setglobal gp_opt14 put "%gp_opt14%"/; $if setglobal gp_opt15 put "%gp_opt15%"/; $if setglobal gp_opt16 put "%gp_opt16%"/; $if setglobal gp_opt17 put "%gp_opt17%"/; $if setglobal gp_opt18 put "%gp_opt18%"/; $if setglobal gp_opt19 put "%gp_opt19%"/; %cmd%.nd = 0; %cmd%.nw = 6; %dat%.nw = 16; %dat%.nd = 8; %dat%.nr = 2; $if dimension 2 %1 $goto twodimen $if not dimension 1 %1 $goto multidim * A. Plot a vector. put 'set nokey'/; put 'plot "%file%.dat" using 1:2'/; $if not "%batch%"=="" put /'quit'/; loop(gp_row, put %dat%, gp_r(gp_row); if (%1(gp_row) eq gp_na, put ' '; else put %1(gp_row); ); put /; ); put //; $goto putclose $label twodimen * B. Plot a two-dimensional array. gp_count=1; put 'plot '; loop(gp_col, if (gp_count gt 1, put ',';); %cmd%.nw = 0 put '\'/' "%file%.dat" index ',(gp_count-1):0:0, ' using 1:2 title "',gp_col.te(gp_col),'"'; %cmd%.nw = 6; gp_count = gp_count + 1; ); $if not "%batch%"=="" put /'quit'/; loop(gp_col, loop(gp_row, put %dat%, gp_r(gp_row); if (%1(gp_row,gp_col) eq gp_na, put ' '; else put %1(gp_row,gp_col); ); put /; ); put //; ); $goto putclose $label multidim * C. Plot a multi-dimensional array gp_count=1; put 'plot '; loop(%series%, if (gp_count gt 1, put ',';); %cmd%.nw = 0 put '\'/' "%file%.dat" index ',(gp_count-1):0:0, ' using 1:2 title "',%series%.te(%series%),'"'; %cmd%.nw = 6; gp_count = gp_count + 1; ); $if not "%batch%"=="" put /'quit'/; loop(%series%, loop(gp_row, put %dat%, gp_r(gp_row); if (%1(gp_row,%series%) eq gp_na, put ' '; else put %1(gp_row,%series%); ); put /; ); put //; ); $label putclose putclose %cmd%; putclose %dat%; * We are done with the row and column sets. Clean them * out so that they can be used a second time: gp_row(gp__1) = no; gp_col(gp__2) = no; $offuni $if not "%batch%"=="" execute '=wgnuplot %file%.plt'; $if "%batch%"=="" execute '=wgnuplot -persist %file%.plt';